Wednesday, October 30, 2013

San Diego Mass Transit

Here is a map of mass transit options in San Diego with a background of projected urban expansion.

San Diego Mass Transit Map


Presentation Attempt (ArcGIS Explorer Online)

Monday, October 28, 2013

Wind Energy: New Turbine Designs

I knew about this classic design: 

But recently, I have learned that there are more efficient, more powerful wind turbine designs out there that could boost wind energy production worldwide. Here are three images and three links that explain new wind turbine designs that I found fascinating, and I want to help other people learn about them.


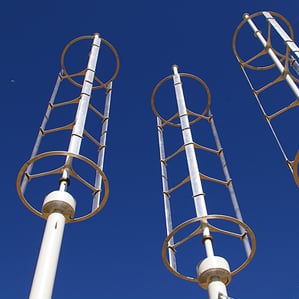
 The Wind Lens design. (They're big in Japan!)


That's pretty cool.


Wednesday, October 16, 2013

India Solar Potential Map

Another solar potential map, inspired by the new 4,000 megawatt plant in the works for Rajasthan.
It is supposed to lower the price of solar powered electricity and compete with coal powered plants.

India Solar Potential Map


Remember to click on icons/polygons to discover what information they contain. Also remember you can turn layers on and off, zoom in to a specific area of interest, change the basemap, and add your own layers from ESRI's ArcGIS Online data.

Thanks ESRI!

(Update 10/28/13: Here is a wind potential map: India Wind Potential. I'm sure others have noticed, but the transmission network already connects to the northern area where there is high wind energy potential. This is because hydro-electric plants exist up there. Seems to me to be a fine place for a relatively large scale wind power facility.)

Monday, October 14, 2013

Removing Duplicate Values from a Field in the Attribute Table

Let's say that you somehow have a layer that has multiple features for a certain field value. And you only want one geographic feature for each value in this field. Maybe from multiple Merges. Anyway, now you want to get rid of the duplicate features. If the dataset is large, you don't want to manually select duplicates. That involves too much work and possibility for human error. After doing some Googling, I found this handy ESRI HowTo page:

HowTo: Identify Duplicate field values

This supplies python code for the field calculator and instructions. After creating a new field, the code outputs a 1 for duplicates and a 0 for the other records. Now you can "select by attributes" to select duplicates, switch selection, and export data that will now have no duplicates. Very handy when dealing with layers that have thousands of features. Thanks ESRI!

Thursday, October 10, 2013

Changing the Perspective

People are used to 2D, flat maps. So am I. So when I was told that a potential transmission line connection between China and the USA could be straight and almost exclusively cover land instead of ocean, I was skeptical. Silly me. I forgot that the real world is 3D, not a flat map! What am I, a 15th century European? (Actually people weren't necessarily so... in the dark) Anyways, check this out:


Thanks Google Earth!

Lesson learned: consider all the perspectives you can. In maps... and in life.

Monday, October 7, 2013

World Energy Information

Here is an interactive map filled with information from the CIA World FactBook that displays different information about world energy usage:

World Energy Info Interactive Map


Here is an ArcMap version showing the percentage of electricity each country receives from renewable energy sources:


Wednesday, October 2, 2013

Solar Energy Map - China

This is another ArcGIS Online example. Click the following link for a map of China's solar power and solar potential.

Solar Energy Map - China

Same Map - ArcGIS Explorer Online Version


Tuesday, October 1, 2013

Joining data by location (spatially)

ArcMap supplies us with the Spatial Join tool, but there is another way to join data by location.  This is very helpful when one wants to have one layer display spatial information from a second layer. For example, you have a California "Counties" layer. You also have a polygon layer for populated areas of California. But you want to change the "Counties" layer's symbology to show relative area or number of national forests inside each county. So you need the "Counties" layer's attribute table to include a field that has the sum of the area of populated place polygons and a sum of the total number of populated place polygons in each county. Still following?

Right click on a feature in the table of contents, click "Join...," and then change the first option to "join data from another layer based on spatial location." Then you can choose to calculate the sum, average, etc. of one layer's field (populated place's population field, shape area field) that spatially is contained in the second layer (counties, in this example). Now the Counties layer contains a field that displays the sum of a field from the Populated Places layer. Pretty sweet.

Tip: if you simply want a count of how many features of one layer are contained in the feature of another layer, just add a short integer field to the first layer in which each feature has a value of one. Then when you calculate the sum, the new field in the second layer will show how many features from the first layer are contained with the fields of the second layer.

Here is a link to ESRI's ArcGIS Help 10.2 page (Joining data by location (spatially) is in the middle of the page):

ArcGIS Help 10.2: About joining and relating tables

The following map supplies an example (Archaeological sites contained in USGS grid quadrangles):
I also wanted to display the relation of site density to supervisor district, so I clipped the USGS Grid layer based on the Supervisor Districts. Then I had to merge the 5 USGS Grid layers back together because I wanted the "Graduated Colors" "Quantities" Symbology to cover the entire county, and didn't want the Natural Breaks skewed from district to district.